


Selective hepatic insulin resistance is a feature of obesity and type 2 diabetes. Whether similar mechanisms operate in white adipose tissue (WAT) of those with obesity and to what extent these are normalized by weight loss are unknown. We determined insulin sensitivity by hyperinsulinemic euglycemic clamp and insulin response in subcutaneous WAT by RNA sequencing in 23 women with obesity before and 2 years after bariatric surgery. To control for effects of surgery, women postsurgery were matched to never-obese women. Multidimensional analyses of 138 samples allowed us to classify the effects of insulin into three distinct expression responses: a common set was present in all three groups and included genes encoding several lipid/cholesterol biosynthesis enzymes; a set of obesity-attenuated genes linked to tissue remodeling and protein translation was selectively regulated in the two nonobese states; and several postobesity-enriched genes encoding proteins involved in, for example, one-carbon metabolism were only responsive to insulin in the women who had lost weight. Altogether, human WAT displays a selective insulin response in the obese state, where most genes are normalized by weight loss. This comprehensive atlas provides insights into the transcriptional effects of insulin in WAT and may identify targets to improve insulin action.
Introduction
Excess white adipose tissue (WAT) mass is linked to a number of cardiometabolic complications, including insulin resistance, type 2 diabetes, and atherosclerotic vascular diseases (1). While this likely depends on several mechanisms, recent data from both animals and humans suggest that reduced insulin sensitivity in adipocytes is an early event in the development of disturbed WAT function and whole-body insulin resistance (2,3). Insulin exerts a complex action on its target cells by triggering several pathways controlling glucose and lipid homeostasis (4), and the short-term effects in liver and skeletal muscle have recently been reported in mice (5). Despite this, it remains unclear to what degree and at what level white adipocytes become insulin resistant in the obese (OB) state.
Bariatric surgery is the most efficient treatment to restore insulin sensitivity, reduce type 2 diabetes risk (6), and normalize WAT function in individuals with obesity (7). Given the large number of pathways regulated by insulin, identifying how pronounced weight loss normalizes WAT insulin signaling at the cellular level requires global analyses (e.g., [phospho]proteomics, metabolomics, or transcriptomics). Using an RNA sequencing technology termed 5′ cap analysis of gene expression (CAGE), we recently demonstrated that obesity is a major determinant of the transcriptional response to insulin in human WAT (8).
The cross-sectional design of our previous (8) as well as other studies (9) only provides interindividual comparisons and cannot provide insights into how insulin resistance is normalized by weight loss. To this end, we followed women with obesity 2 years after bariatric surgery and performed new WAT biopsies and CAGE when they had reached a nonobese state (herein termed postobese [PO]). Because all patients underwent Roux-en-Y gastric bypass surgery, a technique that may in itself influence hormonal responses, we included additional never-obese (NO) control women who were matched for age, BMI, and whole-body insulin sensitivity with the PO individuals. By comparing the OB, PO, and NO women, we were able to dissect to what extent the effect of insulin was influenced by obesity and whether it was partly or fully restored by weight loss.
Research Design and Methods
Cohort Selection
Participants were enrolled in a clinical trial (NCT01727245) studying outcomes of Roux-en-Y gastric bypass surgery. Baseline data from part of the cohort have been reported (8). Given that pronounced weight loss and surgery themselves may influence hormonal responses, we compared the insulin effect in the same women who had reached a nonobese state 2 years after bariatric surgery with that in age-, BMI-, and M value–matched NO women. Because the primary outcome measure was the transcriptomic response to insulin, it was important to obtain balanced group sizes to avoid statistical power issues that could influence data interpretation. We therefore recruited 23 healthy NO women who were matched to PO individuals, resulting in a balanced cohort of 23 OB women, 23 PO women, and 23 NO controls.
Clinical investigations were performed in the morning after an overnight fast. Height, weight, and hip and waist circumferences, resting pulse rate, and blood pressure were determined. Venous blood samples were obtained and analyzed by the accredited routine clinical chemistry laboratory of the hospital, except for insulin and free fatty acids (FFAs), which were analyzed by ELISA (Mercodia, Uppsala, Sweden) and a colorimetric kit method (FUJIFILM Wako Chemicals Europe GmbH, Neuss, Germany), respectively. Adipose tissue insulin resistance was calculated as fasting serum insulin × fasting serum FFAs (10) and correlated with M value (r = −0.74; P < 0.0001). Abdominal subcutaneous WAT biopsies were obtained from the paraumbilical region by needle aspiration under local anesthesia. Thereafter, a hyperinsulinemic euglycemic clamp was performed as described (8). An intravenous bolus dose of insulin (1.6 units/m2 body surface area) (Actrapid; Novo Nordisk, Copenhagen, Denmark) was administered, followed by continuous intravenous infusion of insulin (120 mU/m2 · min) for 120 min. At this insulin infusion rate, hepatic glucose output is completely inhibited, and the glucose infusion rate reflects peripheral (primarily skeletal muscle) glucose uptake (11,12). Plasma glucose values were measured in duplicate every fifth minute (HemoCue, Ängelholm, Sweden). Euglycemia was maintained between 4.5 and 5.5 mmol/L (81 and 99 mg/dL) by a variable intravenous infusion of glucose (200 mg/mL). The mean glucose infusion rate (glucose disposal) between 60 and 120 min was determined (M value; mg of glucose uptake per kg body weight per minute) and was also expressed corrected for mean plasma insulin during steady state. During the clamp, serum samples were collected at −15, −5, 15, 45, 75, and 115 min and maintained at −70°C for subsequent analyses. Insulin was determined at all time points, while FFA levels were determined at −5 and 115 min. The antilipolytic effect of insulin was calculated as the quotient between FFA value at the end of the clamp (115 min) and the baseline value (−5 min). The average values of plasma glucose and insulin at steady state during the clamp were 4.95 ± 0.13 mmol/L and 210 ± 47 mU/L, respectively. Mean FFA level was 0.64 ± 0.16 mmol/L before and 0.03 ± 0.03 mmol/L at the end of the clamp. The second WAT biopsy was obtained from the contralateral paraumbilical side during the last 5 min of the clamp. As discussed (8), this time point was chosen because the glucose infusion rate has reached a steady state, and it allows detection of direct transcriptional responses rather than the secondary effects induced by insulin signaling (e.g., changes in transcription factor [TF] expression) that may influence the results. The study was approved by the regional ethics board. Informed written consent was obtained from all participants before enrollment.
5′ CAGE Profiling and Data Processing
Gene transcripts were analyzed by high-throughput sequencing of the 5′ ends of RNAs using CAGE. This technique assesses the start sites of transcripts and their respective expression with high resolution. Protein coding as well as noncoding transcripts are identified by CAGE tag clusters (TCs). One gene can be described by more than one TC, reflecting expression from more than one promoter. In comparison with microarrays, CAGE is not biased for a preselected set of target transcripts; it has higher sensitivity and a larger dynamic expression range and provides quantitative data that are reliably mirrored by, for example, quantitative polymerase chain reaction (8,13).
Total RNA from WAT was extracted using the RNeasy Lipid Tissue Mini Kit (QIAGEN), and the RNA concentrations were measured using Nanodrop ND-1000 (Thermo Fisher Scientific). Total RNA quality was determined using the Bioanalyzer RNA 6000 Pico Kit (Agilent Technologies). Total RNA with an RNA integrity number greater than seven was used for CAGE profiling. RNA samples were randomized to minimize batch effects, and a barcode was assigned to each. CAGE libraries were prepared individually with a total RNA input of 1,000 ng as mentioned previously (14). Linker dimer contaminations were processed with the E-Gel 2% Starter Kit (Invitrogen) and purified using the QIAquick PCR Purification Kit (QIAGEN). Library quality control was performed with Bioanalyzer using the DNA 1000 Kit (Agilent Technologies). Four barcoded CAGE libraries were pooled and loaded onto one sequencing lane. Libraries were sequenced using the Illumina Hi-SEq 2500 or 2000. The obtained FastQ files were split into four FastQ by barcodes (ACG, ATC, GAT, and CTT) using the FastX Toolkit. The data were filtered as previously described (14). Reads that passed the filtering steps were cross-mapped using Bowtie (15). First, reads were mapped on the human genome (version 19; hg19) and subsequently mapped on the Schizosaccharomyces pombe genome (ASM294) to obtain uniquely mapped hg19 reads. Before merging the resulting CAGE transcription starting site (CTSS), we excluded CTSS with expression <0.1 tags per million (TPM). Paraclu (16) was used to combine adjacent CTSS into 54,527 CAGE TCs. TPM normalized counts from the 138 RNA samples formed the expression data matrix of interest. The top 10 highly expressed TCs were removed, and we included only TCs with expression ≥1 TPM in at least 20% of the samples, resulting in 29,189 TCs. Gencode V19 annotation and FANTOM5 long noncoding RNA annotation (17) were used to assign the TCs to a total number of 15,056 unique genes (Supplementary Table 1).
Bioinformatic Analysis
CAGE data were extracted followed by differential expression analysis of insulin response (hyperinsulinemia/fasting) for the three groups (OB, POB, and NO) using generalized linear models implemented with edgeR (18). Significance was determined by Benjamini-Hochberg–corrected false discovery rate (FDR) (FDR <0.05). We classified the significantly insulin-responding TCs and their respective genes into six classes: 1) insulin responding in OB, POB, and NO (common set); 2) insulin responding in NO and POB (obesity-attenuated set); 3) insulin responding in only two other groups (NO and OB or OB and POB); and 4–6) insulin responding only in one group (NO, OB, or POB enriched).
Gene set enrichment analysis requires as input unique gene IDs. However, in CAGE, multiple TCs are associated with the same gene. To remove this redundancy, we identified for each gene the corresponding most highly expressed TC in the three groups (OB, POB, and NO) and calculated the following score S:

The resulting genes and their related scores were ordered and used as input for gene set enrichment analysis using ClusterProfiler (19), and the results were classified as described above.
To predict TFs acting upon active regulatory regions, we performed genomic region set enrichment analyses using TF binding sites (TFBS) from the UniBind database (20) with the LOLA R package (version 1.12.0) (21). A LOLA custom database was created following instructions (https://databio.org/regiondb), with the sets of TFBS for 231 TFs in 315 cell lines and tissues downloaded from the UniBind database (https://unibind.uio.no; 23 April 2019). Note that a TF can be associated with many TFBS data sets derived from different ChIP-seq experiments. All differentially expressed CAGE TCs were extended by 500 nucleotides upstream and downstream using the bedtools (version 2.26.0) (22) slop subcommand to obtain active regulatory regions. We considered active regulatory regions in the NO, OB, and POB sets. Active regulatory regions in each of these three sets were merged using the bedtools (version 2.26.0) sort and merge subcommands and lifted over to the hg38 version of the human genome with the liftOver tool (23). The same steps were performed on background TCs. Enrichment of the UniBind TFBS sets was computed for each set of active regulatory regions independently (used as LOLA queries) when compared with regions surrounding background TCs (used as the LOLA universe). Specifically, LOLA assessed if each UniBind TFBS set overlapped more with the active than the background region using Fisher exact test. We classified the significantly enriched (P < 0.01) TFBS into the six classes described above. The same procedure was used to identify enriched TFBS for ribosomal proteins. For mapping of target genes in lipid biosynthesis, we used ChIPseq or microarray data from studies of PPARγ (24,25), LXRs (26), SREBPs (27), and ChREBP (28).
Statistical Methods
Unless stated otherwise, all values are mean ± SD and were compared by unpaired two-sided Student t test, assuming unequal variances for comparisons between NO and OB and between NO and POB. Paired two-sided Student t test assuming unequal variances was used for comparison between OB and POB. Fisher exact test was used for the TFBS enrichment analysis.
Data and Resource Availability
All transcriptomic data and analysis scripts are available at https://gitlab.com/daub-lab/adipose_insulin_response_in_humans.git.
Results
Prospective and Cross-sectional Studies of Insulin Action in Vivo
Euglycemic hyperinsulinemic clamp is the gold standard to determine insulin sensitivity in vivo. During this procedure, a fixed dose of insulin (herein 120 mU/m2 · min) is infused while plasma glucose levels are maintained (i.e., clamped) within a tight euglycemic range (4.5–5.5 mmol/L) by the concomitant infusion of glucose at a variable rate. Given that complete suppression of hepatic gluconeogenesis is achieved, the glucose infusion rate at steady state (M value) corresponds to the glucose disposal rate and is therefore a direct measure of peripheral insulin sensitivity. By performing CAGE on biopsies from subcutaneous abdominal WAT before and 2 h into the clamp, we determined the transcriptional response to insulin in vivo in women before and 2 years after weight loss by bariatric surgery. Of the OB women who were recruited, all attained a POB state (i.e., BMI <30 kg/m2 at 2-year follow-up) (Fig. 1A). Given that the effects of insulin in the POB state may be influenced by bariatric surgery per se and/or pronounced weight loss, we recruited NO women as controls who underwent the same investigational protocol as outlined above. High-quality RNA and sequencing results were obtained from NO women who were individually age-, BMI-, and M value–matched to 23 POB women (Fig. 1B–F and Supplementary Fig. 1). Clinical characteristics of this cohort in the fasting state as well as FFA levels before and at the end of the clamp and mean glucose, insulin, and FFA levels during steady state of the clamp are detailed in Supplementary Table 2. As expected, the OB women displayed significantly higher BMI, triglyceride levels, and larger fat cell volume compared with the NO women. They were also insulin resistant, as indicated by high homeostatic model assessment for insulin resistance (Fig. 1D), high adipose tissue insulin resistance (Supplementary Table 2), and low steady-state glucose infusion rate during the clamp (also after correction for mean insulin levels) (Fig. 1E–F). All clinical parameters were normalized after weight loss and not significantly different from the matched NO individuals, except for a difference in fat cell volume and mean insulin levels during the clamp (lower in POB) in concordance with recent reports (7,29,30) (Supplementary Table 2). Mean plasma glucose levels during the clamp were similar, and FFA levels were suppressed in all three groups by >90% at the end of the procedure (Supplementary Table 2). Fat cell volume was associated with FFA suppression (r = 0.34; P = 0.0062), but the correlation became nonsignificant after correction for BMI (results not shown).
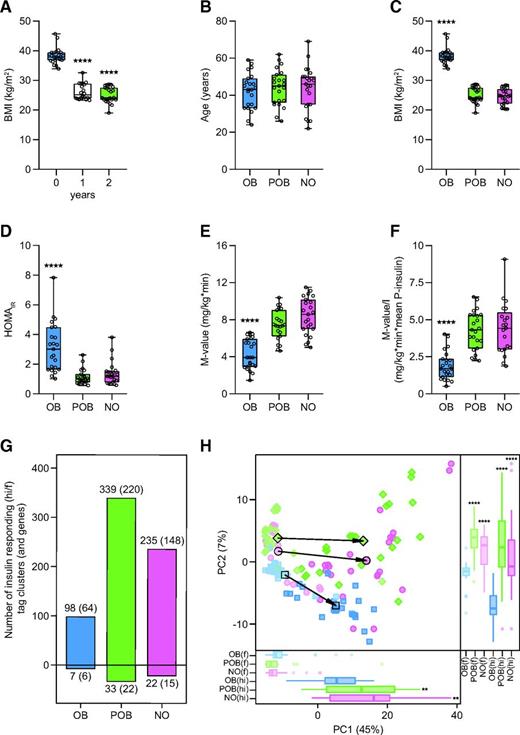
Study design and overview of the insulin response transcriptome in the fasting (f) and hyperinsulinemic (hi) states. A: Twenty-three women with obesity underwent bariatric surgery resulting in significant weight loss after 1 year, which remained stable (<5% mean weight change) at the 2-year follow-up. B–F: There was no difference in age between the groups (B); the OB women displayed higher BMI (C), homeostatic model assessment for insulin resistance (HOMAIR) (D), and M value (E), even after correction for mean insulin levels during the clamp (F). G: Numbers of TCs and genes (in parentheses) displaying significantly altered expression (FDR 5%) upon insulin stimulation in NO, OB, and POB groups. The changes are expressed as hi/f, implying that TCs above the zero line are induced during insulin stimulation, whereas those below the zero line are attenuated by insulin. Note that a majority of TCs are induced by insulin and that the total numbers differ between the three groups. H: Principal component analysis of all 427 insulin-responding TCs (274 genes) in OB (blue), POB (green), and NO (pink) groups, in the f (lighter colors) and hi (darker colors) states. Principal component 1 (PC1) explained 45% of the total variance and reflected the insulin effect as well as the differences between the groups. Overall, the two nonobese groups (NO and POB) were similar in both f and hi states and clearly different from the OB group. Asterisks denote the difference in BMI between baseline (0 years) and 1- and 2-year follow-up, respectively, by paired Student t test (A), the difference between OB and NO/POB by Student t test (paired for OB vs. POB or unpaired for OB vs. NO and POB vs. NO) (C–F), and the difference between OB vs. POB or NO in the same condition (hi or f) (H). **P < 0.01, ****P < 0.0001.
Study design and overview of the insulin response transcriptome in the fasting (f) and hyperinsulinemic (hi) states. A: Twenty-three women with obesity underwent bariatric surgery resulting in significant weight loss after 1 year, which remained stable (<5% mean weight change) at the 2-year follow-up. B–F: There was no difference in age between the groups (B); the OB women displayed higher BMI (C), homeostatic model assessment for insulin resistance (HOMAIR) (D), and M value (E), even after correction for mean insulin levels during the clamp (F). G: Numbers of TCs and genes (in parentheses) displaying significantly altered expression (FDR 5%) upon insulin stimulation in NO, OB, and POB groups. The changes are expressed as hi/f, implying that TCs above the zero line are induced during insulin stimulation, whereas those below the zero line are attenuated by insulin. Note that a majority of TCs are induced by insulin and that the total numbers differ between the three groups. H: Principal component analysis of all 427 insulin-responding TCs (274 genes) in OB (blue), POB (green), and NO (pink) groups, in the f (lighter colors) and hi (darker colors) states. Principal component 1 (PC1) explained 45% of the total variance and reflected the insulin effect as well as the differences between the groups. Overall, the two nonobese groups (NO and POB) were similar in both f and hi states and clearly different from the OB group. Asterisks denote the difference in BMI between baseline (0 years) and 1- and 2-year follow-up, respectively, by paired Student t test (A), the difference between OB and NO/POB by Student t test (paired for OB vs. POB or unpaired for OB vs. NO and POB vs. NO) (C–F), and the difference between OB vs. POB or NO in the same condition (hi or f) (H). **P < 0.01, ****P < 0.0001.
Insulin Induces Distinct Transcriptional Responses in OB and Nonobese States
In total, we performed CAGE on 138 WAT biopsies derived from the fasting and hyperinsulinemic conditions in OB, POB, and NO participants. Using a 5% FDR, we observed significant insulin-mediated expression changes of 427 CAGE TCs corresponding to 274 genes (218 protein-coding and 56 noncoding genes) (Supplementary Table 3). The three groups displayed clear differences in the number of insulin-responsive transcripts; we identified 105 insulin-responsive TCs (70 genes) in the OB group, 372 (242 genes) in the POB group, and 257 (163 genes) in the NO group (Fig. 1G). In all three groups, a vast majority of TCs (OB 93%; POB 91%; NO 91%) were upregulated by insulin. A principal component analysis of these insulin-responsive transcripts showed that NO and POB women displayed an overall similarity in insulin response, which differed from that in OB women (Fig. 1H).
Our primary analysis could not inform to what extent the insulin responses of the three groups were facilitated by the same or different genes. To address this, we compared insulin responses at the level of individual transcripts in each group independently (Supplementary Table 3). This enabled us to identify a common core set of 88 TCs (57 genes) that were regulated in all three groups (Fig. 2A). These TCs displayed the most pronounced expression fold-changes in response to the insulin challenge (Fig. 2B–D) and included genes that are established insulin targets (e.g., PNPLA3, LDLR, ANGPTL8 [C19orf80], DUSP4, CTGF, PDK4, and DEPP1 [C10orf10]). Additional analyses showed that while this common transcriptional response was indistinguishable between POB and NO groups (Supplementary Fig. 2A), the fold-change was on average less pronounced in the OB group (Supplementary Fig. 2B–C). Another set of 119 TCs (78 genes) was shared between the two nonobese groups (NO and POB) and was not present in OB individuals (Fig. 2A). These genes represent the part of the insulin response that was attenuated in OB insulin-resistant individuals but normalized in the nonobese insulin-sensitive state (herein referred to as obesity-attenuated genes) and included, for example, KCNE1, KCNK5, C15orf39, G0S2, KLC2, and LRP8. Notably, there was an additional large set of 159 TCs (102 genes) (e.g., CITED2, DUSP6, CYRIA [FAM49A], GAS2L2, IRF8, and ZFP41) that was enriched in POB women (Fig. 2A). Although these POB-enriched genes displayed expression changes in the same direction in NO and OB women (Supplementary Fig. 2D–F), they were only significant in POB women and displayed overall lower fold-change responses compared with the common and obesity-attenuated genes. Additionally, smaller gene sets (Fig. 2A) were enriched in NO women (NO specific; 44 TCs corresponding to 24 genes) or were observed only in one or two of the subgroups (17 TCs corresponding to 13 genes) and were not further studied.
![Figure 2. Insulin-induced expression response in NO, OB, and POB groups. A: Insulin-responsive TCs and corresponding numbers of genes (in parentheses) in the three groups. TCs are color coded as those common among all three groups (orange), shared between NO and POB (yellow), shared between NO and OB (white), shared between OB and POB (blue), and specific to NO (pink), OB (red), and POB (green). B–D: Volcano plots of the insulin-induced response in the NO (B), OB (C), and POB (D) groups depicting expression response significance (FDR) of individual TCs on the y-axis in relation to fold-change (expressed as hyperinsulinemic/fasting [hi/f]) on the x-axis. Individual TCs are color coded as defined in panel A.](https://ada.silverchair-cdn.com/ada/content_public/journal/diabetes/70/7/10.2337_db21-0001/1/m_db210001f2.jpeg?Expires=1716288961&Signature=FZznP5e4gZ9ziclISkKEbBxdgD8Mm80Y3g4J01npjvNH6ryULbmVB-bRWgcZy09APU9evdlbksEQgRfIZR2l80AMp798FSmhIwd0oVemfjG6z9M1YO4I0qZ-~9oYioXNgO1~rQ-jeENono~W-afUmS~ZEao4VvKfzhtly1mIf8LD2Qtx2FpuOyz0nFQ3khPnPbXLNe05DYp3i6v7X-hoWKzO2SC23Un4HIoMNAtIk2iP3ve~8Lz5X3-YPEB3ZX5ArJTJxT3i8wmigeo1e0aoOmE3pgYOxDSMjUZsRt0RhYVk1hP9ZoziA3BXMHyiIKDcOxXElLYmDeL~F3V9oCVWsg__&Key-Pair-Id=APKAIE5G5CRDK6RD3PGA)
Insulin-induced expression response in NO, OB, and POB groups. A: Insulin-responsive TCs and corresponding numbers of genes (in parentheses) in the three groups. TCs are color coded as those common among all three groups (orange), shared between NO and POB (yellow), shared between NO and OB (white), shared between OB and POB (blue), and specific to NO (pink), OB (red), and POB (green). B–D: Volcano plots of the insulin-induced response in the NO (B), OB (C), and POB (D) groups depicting expression response significance (FDR) of individual TCs on the y-axis in relation to fold-change (expressed as hyperinsulinemic/fasting [hi/f]) on the x-axis. Individual TCs are color coded as defined in panel A.
Insulin-induced expression response in NO, OB, and POB groups. A: Insulin-responsive TCs and corresponding numbers of genes (in parentheses) in the three groups. TCs are color coded as those common among all three groups (orange), shared between NO and POB (yellow), shared between NO and OB (white), shared between OB and POB (blue), and specific to NO (pink), OB (red), and POB (green). B–D: Volcano plots of the insulin-induced response in the NO (B), OB (C), and POB (D) groups depicting expression response significance (FDR) of individual TCs on the y-axis in relation to fold-change (expressed as hyperinsulinemic/fasting [hi/f]) on the x-axis. Individual TCs are color coded as defined in panel A.
Distinct Transcriptional Regulators and Pathways Are Selectively Controlled by Insulin
To determine putative upstream regulators and categorize the observed insulin-regulated genes into pathways, we defined overrepresented TFBS (Fig. 3A–B and Supplementary Table 4) and gene sets (Fig. 3C–D and Supplementary Table 5) that were either shared or specific to the three groups. From this, we identified common activities (PPARγ, C/EBPβ, SREBP, RELA, and LXRα (Fig. 3B) linked to anabolic pathways (e.g., lipid and cholesterol biosynthesis and adipogenesis and nutrient sensing) (Fig. 3D), obesity-attenuated activities (androgen receptor, glucocorticoid receptor, CEBPα, and RUNX2) associated with adaptive responses and tissue remodeling pathways (e.g., kinase activity and angiogenesis, TGFβ signaling, and ribosomal protein subunits) (Fig. 3D), and POB-enriched activities (EBF1, estrogen receptor α, and SMAD3) linked to pathways involved in epigenetic regulation of gene expression (e.g., chromatin remodeling and one-carbon metabolism) (Fig. 3D). The expression of the individual TFs in response to insulin in OB, POB, and NO groups is shown in Supplementary Fig. 3. Overall, with the exception of SREBF1 and CEBPB, the genes encoding the corresponding TFs were not significantly regulated by insulin at the transcriptional level, suggesting that the observed TFBS activities were due to posttranscriptional events.
![Figure 3. TF activities regulating state-specific insulin responses and gene set enrichment analysis of insulin-responsive genes. A bioinformatic analysis of the gene sets in NO, OB, and POB groups enabled identification of the corresponding TFs underlying the observed expression responses. A: The numbers of TFs for the overrepresented (P < 0.01) TFBS sets in the different groups were subdivided using the same colors as in Fig. 2A. B: Graphs provide the Fisher exact test P values (x-axis) and odds ratios (y-axis) for the enrichment of TFBS sets from UniBind (see “Research Design and Methods”) for OB, POB, and NO groups, where individual TFs are indicated (with highest significance) and colored using the same annotation as in panel A. The highlighted TFs were common (PPARγ [encoded by PPARG], C/EBPβ [CEBPB], RELA [RELA], SREBPs [SREBF1 and SREBF2], and LXRα [NR1H3]), obesity attenuated (androgen receptor [AR], glucocorticoid receptor [NR3C1], CEBPα [CEBPA], and RUNX2 [RUNX2]), or POB enriched (EBF1 [EBF1], estrogen receptor α [ESR1], and SMAD3 [SMAD3]). C: The insulin-responding genes corresponding to TCs identified in Fig. 1 were analyzed by gene set enrichment analysis, where the corresponding pathways were grouped using the same color code as in Fig. 2A. D: Pathways enriched in the common, OB-attenuated, and POB-enriched states were grouped to reduce redundance, and three representative ranked genes are indicated. Even if Gene Ontology terms were shared, all the individual genes in the respective pathways differed among the three groups. ECM, extracellular matrix; NES, normalized enrichment score.](https://ada.silverchair-cdn.com/ada/content_public/journal/diabetes/70/7/10.2337_db21-0001/1/m_db210001f3.jpeg?Expires=1716288961&Signature=o9lRZ1yFgARBPkf5IeySzAtZWfBueCmQ2uEL3t54Yv3HbBLVfts1cFqfF2L9BRlevOADaiiTOpfNbsgjjk7ccpFSEft6zabc3xifYfmsMaCVSFU36gchJXHnToNqfgWIDBydqV3iUU0ahsxQrGat4JhgNE-xQ837~5FvWWWjVlkakTab0sxq85Xoj0e56YYkqLZ4ePAX-9HAY19QkAHklxDQzMvfp396YmwbAUUcdZYW5dbGDbKnJTPIgb4UALyNEBKBlgBuh3aPZAgVgPzv1PDEyENVtFXtSzpPBpXJacJAZGVyaWdYGShexn5QSkMfpCky2O61yCeMQ1~~eByebQ__&Key-Pair-Id=APKAIE5G5CRDK6RD3PGA)
TF activities regulating state-specific insulin responses and gene set enrichment analysis of insulin-responsive genes. A bioinformatic analysis of the gene sets in NO, OB, and POB groups enabled identification of the corresponding TFs underlying the observed expression responses. A: The numbers of TFs for the overrepresented (P < 0.01) TFBS sets in the different groups were subdivided using the same colors as in Fig. 2A. B: Graphs provide the Fisher exact test P values (x-axis) and odds ratios (y-axis) for the enrichment of TFBS sets from UniBind (see “Research Design and Methods”) for OB, POB, and NO groups, where individual TFs are indicated (with highest significance) and colored using the same annotation as in panel A. The highlighted TFs were common (PPARγ [encoded by PPARG], C/EBPβ [CEBPB], RELA [RELA], SREBPs [SREBF1 and SREBF2], and LXRα [NR1H3]), obesity attenuated (androgen receptor [AR], glucocorticoid receptor [NR3C1], CEBPα [CEBPA], and RUNX2 [RUNX2]), or POB enriched (EBF1 [EBF1], estrogen receptor α [ESR1], and SMAD3 [SMAD3]). C: The insulin-responding genes corresponding to TCs identified in Fig. 1 were analyzed by gene set enrichment analysis, where the corresponding pathways were grouped using the same color code as in Fig. 2A. D: Pathways enriched in the common, OB-attenuated, and POB-enriched states were grouped to reduce redundance, and three representative ranked genes are indicated. Even if Gene Ontology terms were shared, all the individual genes in the respective pathways differed among the three groups. ECM, extracellular matrix; NES, normalized enrichment score.
TF activities regulating state-specific insulin responses and gene set enrichment analysis of insulin-responsive genes. A bioinformatic analysis of the gene sets in NO, OB, and POB groups enabled identification of the corresponding TFs underlying the observed expression responses. A: The numbers of TFs for the overrepresented (P < 0.01) TFBS sets in the different groups were subdivided using the same colors as in Fig. 2A. B: Graphs provide the Fisher exact test P values (x-axis) and odds ratios (y-axis) for the enrichment of TFBS sets from UniBind (see “Research Design and Methods”) for OB, POB, and NO groups, where individual TFs are indicated (with highest significance) and colored using the same annotation as in panel A. The highlighted TFs were common (PPARγ [encoded by PPARG], C/EBPβ [CEBPB], RELA [RELA], SREBPs [SREBF1 and SREBF2], and LXRα [NR1H3]), obesity attenuated (androgen receptor [AR], glucocorticoid receptor [NR3C1], CEBPα [CEBPA], and RUNX2 [RUNX2]), or POB enriched (EBF1 [EBF1], estrogen receptor α [ESR1], and SMAD3 [SMAD3]). C: The insulin-responding genes corresponding to TCs identified in Fig. 1 were analyzed by gene set enrichment analysis, where the corresponding pathways were grouped using the same color code as in Fig. 2A. D: Pathways enriched in the common, OB-attenuated, and POB-enriched states were grouped to reduce redundance, and three representative ranked genes are indicated. Even if Gene Ontology terms were shared, all the individual genes in the respective pathways differed among the three groups. ECM, extracellular matrix; NES, normalized enrichment score.
Integrative Analyses Identify Insulin Responses Present or Lost in the OB State
By mining this comprehensive transcription atlas, we provide examples of common, obesity-attenuated, and POB-enriched insulin responses. As outlined in Fig. 4A (and further expanded in Supplementary Fig. 4), a prominent signature in the common class was the ability of insulin to induce multiple genes encoding proteins regulating the biosynthesis of fatty acids de novo (ACC, ACLY, and FASN), glycerolipids (GPAM and LPIN1), and cholesterol (HMGCS, HMGCR, and MVD) as well cholesterol transport (ABCA1, ABCG1, and LDLR). These are all well-established target genes of SREBPs, PPARγ, and/or LXRs, indicating that the activities of these TFs are present even in the OB state (Supplementary Fig. 4). In support of this, these TFs were all classified as common in our TFBS enrichment analysis (Fig. 3B).
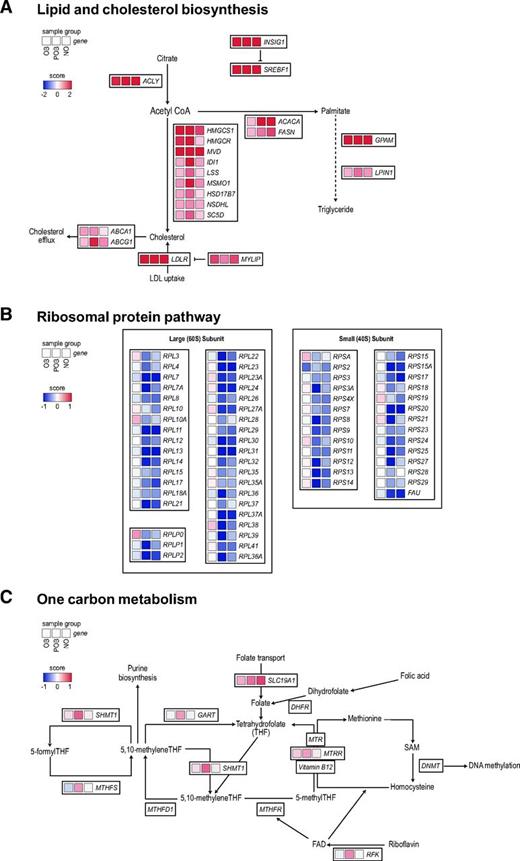
Differentially regulated pathways in the OB and nonobese states. Representative examples of pathways identified in the gene set enrichment analysis that were common, obesity attenuated, or POB enriched. A: The lipid and cholesterol biosynthesis pathway, the corresponding genes, and their S-score (see “Research Design and Methods”) in OB, POB, and NO groups are shown. An expanded version of this panel is detailed in Supplementary Fig. 4. B–C: The same analyses are shown for ribosomal proteins (B) and one-carbon metabolism (C).
Differentially regulated pathways in the OB and nonobese states. Representative examples of pathways identified in the gene set enrichment analysis that were common, obesity attenuated, or POB enriched. A: The lipid and cholesterol biosynthesis pathway, the corresponding genes, and their S-score (see “Research Design and Methods”) in OB, POB, and NO groups are shown. An expanded version of this panel is detailed in Supplementary Fig. 4. B–C: The same analyses are shown for ribosomal proteins (B) and one-carbon metabolism (C).
Among TCs that were enriched only in the nonobese state (obesity attenuated), we identified 65 genes encoding small (n = 27) and large (n = 38) ribonucleoproteins (RNPs) that were coordinately downregulated by insulin only in the POB and NO groups (Fig. 4B). These genes encode structural components of the large and small subunits of the ribosomes. Given that the response included many genes and was distinct in the nonobese groups compared with the OB group, we performed a separate TFBS analysis on this gene set. This identified an enrichment of TFBS for TFs belonging to the ETS family (e.g., ETS1, ETV1, ELK1, ELK4, and ERG), GABPA, and YY1 (Supplementary Fig. 5 and Supplementary Table 6), factors that have been shown to regulate RNP expression in both humans and other species (31,32).
Regarding the POB-enriched class, the insulin-induced effects were on average less pronounced than those in common and obesity-attenuated gene sets. Nevertheless, we identified several genes encoding enzymes catalyzing different reactions in one-carbon metabolism (RFK, SHMT1, GART, MTRR, and MTHFS) to be upregulated by insulin in the POB state (Fig. 4C). Accordingly, the motif activities in the POB-enriched class included EBF1 and ESR1, two TFs that have been shown to regulate one-carbon metabolism in other cell systems (33,34).
Discussion
Our major finding is that the overall insulin-induced transcriptional response in human WAT is selective and can be disentangled into at least three distinct patterns in NO and OB individuals before and after long-term weight loss. A common set of insulin-regulated genes is shared in all three groups and is therefore also present in the OB insulin-resistant state. Another gene set displays a response to insulin only in the nonobese groups and is largely lost in obesity. A third group of genes responds to insulin to a more significant degree specifically in women who have lost weight after bariatric surgery.
We observed that part of the insulin response in WAT, characterized by an increased expression of multiple genes encoding de novo lipogenesis and cholesterol biosynthesis enzymes, also remains present in severely OB women. This is similar to findings in murine 3T3-L1 adipocytes (35,36) as well as liver, where insulin resistance is selective in different models of obesity (37,38). Thus, while the suppressive effects of insulin on hepatic glucose production are attenuated, the stimulatory effects on de novo lipogenesis and lipid storage remain largely intact. Together with the data presented herein, we suggest that insulin-induced transcriptional effects on genes involved in energy storage are universal features present in the OB insulin-resistant state across multiple tissues. Clinical observations align with this notion, as common adverse effects of insulin treatment in people with obesity and type 2 diabetes include weight gain and lipid accumulation in peripheral organs (39). That selective insulin resistance has pathophysiological importance is also supported by animal models, where a complete block of insulin signaling by liver-specific insulin receptor knockout results only in hyperglycemia, whereas the selective insulin resistance induced by high-fat diet also induces hypertriglyceridemia and hepatic steatosis (38,40).
In contrast to the common lipid synthesis signature, the insulin-induced response observed only in the two nonobese groups was characterized by an increased activity of pathways regulating extracellular matrix composition and vascularization. This suggests that insulin in nonobese individuals can affect WAT expansion not only via increased lipid storage but also through effects on factors involved in tissue remodeling and angiogenesis. Based on this, we speculate that obesity results in an imbalance between insulin-induced lipid synthesis/storage and tissue remodeling, which in turn promotes ectopic lipid deposition. This notion is in line with results in both humans and mice demonstrating WAT expansion mechanisms are disturbed in obesity (41).
Another signature specifically linked to the nonobese state was the coordinated insulin-mediated downregulation of genes encoding multiple RNP subunits. Data from cell/animal models and human ribosomopathies have linked RNP expression to metabolism by altering, for example, glycolysis and mitochondrial function (42). The underlying mechanisms are less well understood, but in the current paradigms, both increased and decreased expression of RNPs alter the affinity of ribosomes to specific mRNAs, which in turn affects the translation of individual proteins (43). In addition, ribosomal subunits interact directly with metabolic enzymes and may therefore affect metabolic pathways such as glycolysis (44). However, while it is clear that short-term hyperinsulinemia downregulates RNP expression, it remains to be shown how this affects WAT function downstream of insulin in the nonobese state.
Among the pathways attenuated in OB individuals was also circadian rhythm. Recent results show that insulin controls the core clock machinery in both cell models and mice and thereby plays a role in synchronizing gene expression upon food intake (45). It is therefore tempting to speculate that the ability of insulin to regulate the internal clock is impaired in the OB state. In support of this, we also identified additional obesity-attenuated factors, including the TGFβ pathway, which has been shown to reset diurnal rhythm (46). However, given that our results only provide a snapshot of the transcriptome after 2 h of hyperinsulinemia, we cannot establish whether the observed effects on gene expression affect the phase and/or amplitude of circadian rhythm.
Among the POB-enriched transcripts, we identified several genes encoding one-carbon metabolism enzymes to be upregulated by insulin. Because the one-carbon cycle provides substrates for many processes, including DNA methylation, this suggests that epigenetic mechanisms may be promoted by insulin in the POB state. Previous studies have shown that the global adipocyte DNA methylome is significantly altered in OB women after weight loss (47). The overlap between differentially methylated genes in the latter study and the insulin-induced genes identified herein was, however, limited (results not shown). Several of the POB-enriched genes showed similar regulation by insulin to NO and OB genes, but the effects were less pronounced and did not reach statistical significance. We therefore interpret these results with some caution. Nevertheless, they may reflect that the POB state displays an increased WAT response to insulin. This is in line with previous studies demonstrating that PO individuals differ from NO individuals at both the whole-body (e.g., attenuated resting metabolic rates/whole-body fat oxidation (48,49)) and WAT levels (fat cell volume, adipokine secretion, and lipolysis) (7,29).
The combined cross-sectional and prospective comparisons of carefully matched women allowed us to study the dynamic transcriptional response to insulin in vivo. A caveat in interpreting our data is that they were obtained under hyperinsulinemic conditions, which may exaggerate the observed transcriptional events. We could have used a lower insulin dose during the clamp, but this would not have been sufficient to inhibit hepatic gluconeogenesis in the OB group and would therefore have affected cross-group comparisons. Also, insulin was infused via a peripheral vein and not (as endogenous insulin) via the portal vein, where insulin clearance is observed via a first-passage effect in the liver. However, the clamp approach enabled us to determine the effects of insulin under normoglycemic conditions. This is important, given that both hyper- and hypoglycemia induce counterregulatory hormonal responses that in turn affect transcriptional regulation in multiple tissues, including WAT. Finally, that some of the observed transcriptional results may be specifically related to bariatric surgery is unlikely, given recent data demonstrating that weight loss induced by bariatric surgery or diet alone provided similar metabolic effects in patients with obesity and type 2 diabetes (50).
In summary, we identify how insulin-regulated genes, pathways, and TFs respond to changes in body weight. This comprehensive resource may further our understanding of the pathophysiology of WAT insulin resistance in obesity and identify novel targets to improve insulin action.
Clinical trial reg. no. NCT01727245, clinicaltrials.gov.
This article contains supplementary material online at https://doi.org/10.2337/figshare.14414495.
Article Information
Funding. This work was supported by grants from the Margareta af Uggla Foundation (M.R.); the Swedish Research Council (M.R., P.A., N.M.); SPHERES/European Research Council Synergy Grant 856404 (M.R.); the Knut and Alice Wallenberg Foundation (Wallenberg Clinical Scholar to M.R. and grant nr 2018.0094 to M.R. and C.O.D.); Tripartite Immuno-metabolism Consortium grant NNF15CC0018486, Multi-Scale Additive Manufacturing Consortium grant NNF15SA0018346, and MeRIAD Consortium grant 0064142 from the Novo Nordisk Foundation (M.R.); Novo Nordisk Foundation grant NNF20OC0061149 (N.M.); the Swedish Diabetes Foundation (M.R.); the Stockholm County Council (M.R., D.P.A.); Research Council of Norway grant 187615; Helse Sør-Øst; and the University of Oslo through the Centre for Molecular Medicine Norway (A.M.), Research Council of Norway grant 288404 (A.M.), Norwegian Cancer Society grant 197884 (A.M.), Erling-Persson Family Foundation grant 140604 (A.T.) and the Strategic Research Program in Diabetes at the Karolinska Institutet (M.R., P.A., D.P.A., H.G., C.O.D.). The computations and data handling were enabled by resources from project 2017/7-412 provided by the Swedish National Infrastructure for Computing at UPPMAX, partially funded by the Swedish Research Council through grant agreement 2018-05973. D.P.A., P.A., N.M., and M.R. are supported by CIMED.
Duality of Interest. K.H.M.K. was funded by a Novo Nordisk Postdoc Fellowship. No other potential conflicts of interest relevant to this article were reported.
Author Contributions. E.M., K.H.M.K., A.M., J.J., L.M., P.A., N.M., C.O.D., and M.R. analyzed and interpreted the data. E.M., K.H.M.K., A.M., and C.O.D. performed bioinformatic analyses. E.M., K.H.M.K., P.A., N.M., C.O.D., and M.R. drafted the article. E.M., D.P.A., A.M., A.R., J.B., J.J., L.M., A.T., H.G., C.O.D., and M.R. collected the data. P.A., C.O.D., and M.R. conceived and designed the study. N.M., C.O.D., and M.R. critically revised the manuscript for important intellectual content. All authors provided final approval of the manuscript. M.R. is the guarantor of this work and, as such, had full access to all the data in the study and takes responsibility for the integrity of the data and the accuracy of the data analysis.